On March 24, 2026, ARM CEO Rene Haas stepped onto a San Francisco stage and broke 35 years of company tradition. He announced ARM’s first in-house silicon and declared that agentic computing is driving a fourfold increase in CPU demand. Then he added something that hit me hard: “We may be under-calling that number. I think the demand is higher than we think it is.”
He’s right. But not entirely for the reasons he speculated.
ARM’s model accounts for what agents do externally: orchestrating accelerators, exchanging data, managing API traffic across distributed systems, and trading coin. That’s a real and significant demand signal. But there is a second signal that doesn’t appear in their model, because it isn’t about agents acting on the world. It’s about agents acting on themselves.
I call it agent self-care.
Agent self-care is the autonomous investment agents make in testing, validation, deployment infrastructure, and documentation — not because they are explicitly instructed to, but because agents self-correct when the design architecture includes adverserial tension between agents. Each generative agent is paired with at least one editorial agent with the goal of improving the output of other agents. Quality arises as a community concern. And it has infrastructure economics implications that nobody has yet accounted for — including ARM.
I know this because I’ve been measuring it in git data. For the past several months I’ve been using CommitPulse — an open-source git analytics tool I built — to analyze the engineering composition of codebases ranging from my own agentic development portfolio to some of the most significant open source projects on GitHub: OpenClaw, WordPress, Rails, OpenRocket, and Supabase. Across five independent codebases, in different languages, different domains, and different team structures, the data shows the same pattern. And in October 2025, every one of them shows the same inflection point.
That convergence is what the first charts are about.
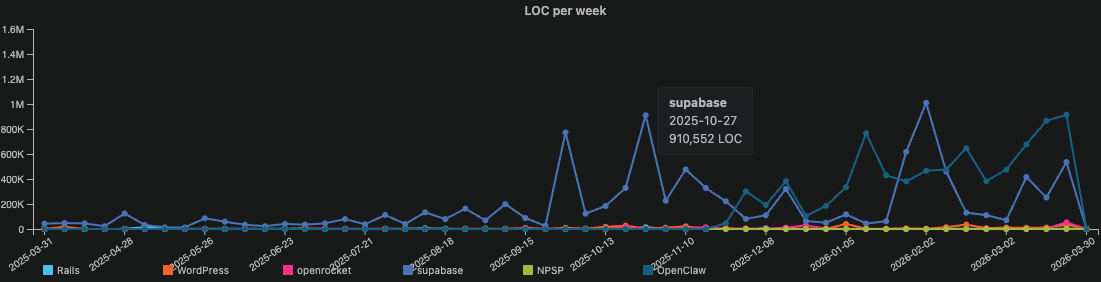
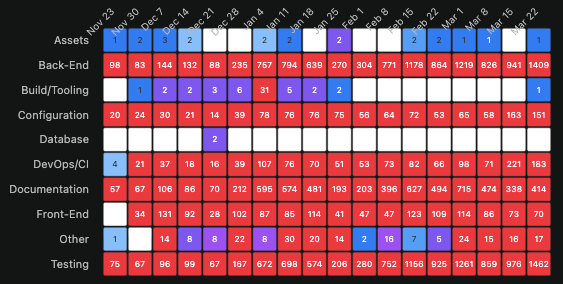
This chart shows the weekly contribution of lines of code (LOC) written for each public repo: WordPress, Rails, Supabase, OpenClaw, and OpenRocket.
For most of the chart, the pre-agentic repos are indistinguishable from the baseline. Hundreds of lines of code per week. Occasionally a few thousand. The work of dozens of contributors across years of active development registers as a faint tremor along the bottom of the frame. You have to look carefully to see them at all.
Then the last quarter of 2025 arrives and the chart changes.
The scale is so different from everything else in the dataset that the pre-agentic repos — Rails with its twenty years of history, WordPress with its millions of production installations — flatten into what looks like a geological baseline against the explosive peaks of the agentic tsunami.
The difference between pre-agentic and agentic output velocity in this chart is not a matter of degree. It is a matter of kind. It is the difference between standing at the edge of a river and standing at the edge of the Grand Canyon. Both are water cutting through rock. The physics are the same. But the scale changes what the thing actually is.
But OpenClaw isn’t the only story in this chart.
Look at the Supabase line. On the week of October 27, 2025 — before OpenClaw’s November eruption even begins — Supabase produces 910,552 lines of code in a single week. Nearly a million lines. From a team building a production platform trusted by thousands of enterprise customers. Supabase wasn’t chasing the agentic wave. It was already in it.
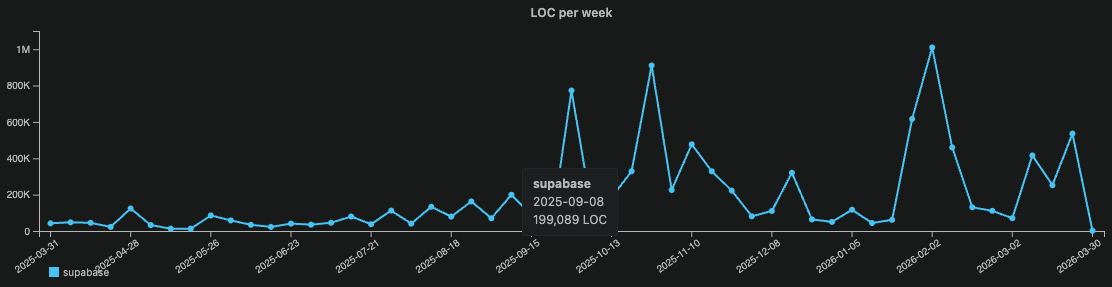
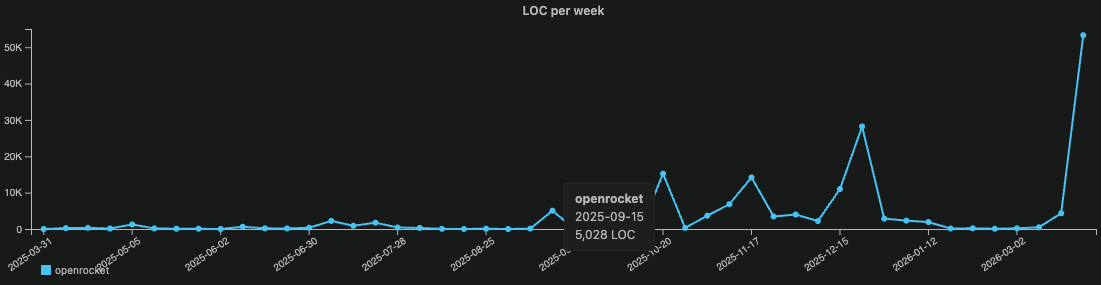
I chose Supabase and OpenRocket as pre-agentic comparison points. Supabase is a well-funded TypeScript cloud platform serving millions of developers. OpenRocket is a Java aerodynamics simulator for model rockets — maintained by volunteer aerospace enthusiasts in their spare time. It is, quite literally, rocket science. Two more different codebases would be difficult to find.
Both show the same thing.
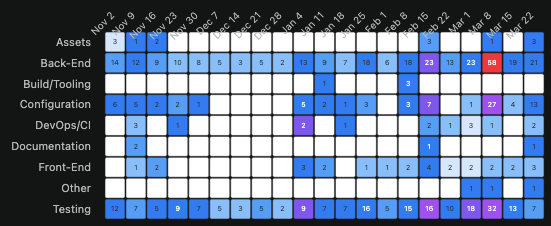
For many years up until August 2025, Supabase runs a consistent baseline — occasional spikes to 200K LOC per week but mostly steady. Then something changes in September 2025. Output climbs to 700K. Then 900K. Then approaching 1M lines of code in a single week in early 2026. That is not organic team growth. That is a step-change that maps almost precisely to when agentic engineering practices became mainstream in the developer community.
OpenRocket tells the same story at a smaller scale. Flat through several years. Then October 2025 — activity pulses begin. December, a moderate spike. March 2026, a leap to 50K+ that dwarfs everything before it.
A Java rocket simulator maintained by hobbyist engineers is showing the same agentic adoption signature as a well-funded cloud platform. Cross-language. Cross-domain. Cross-team-size. The same inflection point.
This study did not set out to document the moment the software development ecosystem began to shift. But that appears to be what the data captured.
Volume, however, is only the first dimension. Knowing that agentic engineering produces more doesn’t tell you what it actually produces. A river running at Grand Canyon scale is still just water if it carries the same sediment. The question isn’t how much code is being written. It’s what kind of code — and in what proportions.
That’s where the data gets strange.
Finding One: The Structural Inversion
The Lines-of-Code (LOC) charts above measure the size of the wave. The next charts measure the composition. And when I first saw it, I had to look twice.
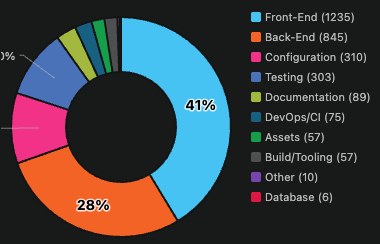
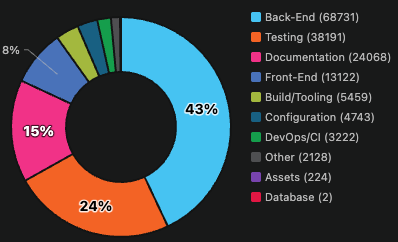
In a pre-agentic engineering profile, the codebase tells a familiar story. Frontend and Backend dominate. Testing hovers in the single digits. DevOps/CI barely registers. This is not negligence — it’s the rational output of human engineering under real constraints. Careers are built on features. Deadlines are set against deliverables. Testing and DevOps get the hours that are left over, which is rarely enough.
My double-take came while observing my own agentic portfolio, I noticed this composition inverts. Testing and DevOps together represent 44% of the codebase. Frontend drops to 8%. The categories like testing that human teams perpetually defer become the categories that dominate.
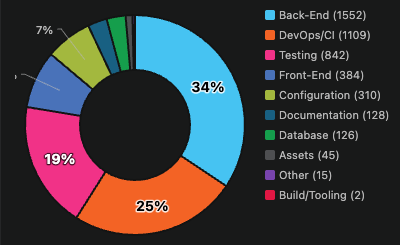
This is not because I instructed my agents to write more tests. I didn’t. It emerged. Well-designed agentic systems self-correct toward quality scaffolding because that’s how they manage their own uncertainty. They invest in deployment infrastructure because they’re biased toward autonomous action. The testing and DevOps investment isn’t a prioritization decision. It’s a behavioral signature.
Every test commit in a cloud engineering workflow triggers a GitHub Actions runner. Every deployment pipeline fires AWS CloudFormation. Every CI cycle spins up ephemeral compute. The agent writing 1,462 test commits in a single week isn’t just consuming local CPU. It’s triggering cloud infrastructure at a rate no human team would generate. The self-care bill lands in two places simultaneously: at the edge where the agent works, and in the cloud where its work is validated and deployed.
This creates a demand multiplier that current infrastructure models aren’t capturing. Agent self-care doesn’t just add CPU cycles. It adds CPU cycles across the entire infrastructure stack — local compute, CI runners, cloud deployment pipelines — all triggered autonomously, all scaling proportionally with agentic adoption, none of it accounted for in ARM’s fourfold demand estimate.
This is agent self-care made visible in file composition data.
Finding Two: Agent Self-Care in the Architecture
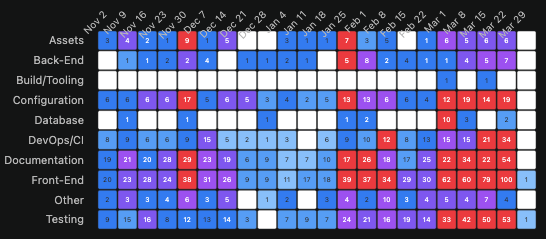
The architectural drift heatmaps are the most executive-readable charts in this dataset. No explanation required — darker cells mean more activity, and the pattern speaks for itself.
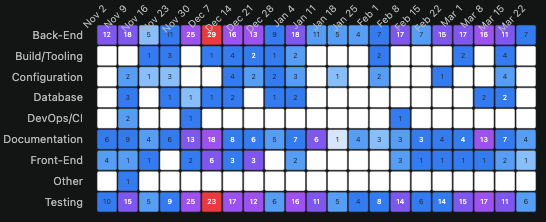
Rails and WordPress show two-layer engineering. Backend and Frontend receive nearly all commit activity across their entire observable history. DevOps/CI is almost invisible. This is not a criticism — it’s the rational output of human teams working under deadline pressure against feature requirements. The infrastructure layers get touched reactively, not proactively. There is never enough time to go back.
OpenClaw’s heatmap looks like a different universe. Every architectural layer is alive simultaneously. Testing hits 1,462 commits in a single week — a number Rails has never approached in any week of its twenty-year existence. Documentation runs at 400-700 commits per week sustained. DevOps/CI maintains consistent presence throughout. Backend and Testing scale together rather than trading off against each other.
That last point deserves emphasis. In human engineering, testing and features compete for the same developer hours. When velocity increases, coverage typically drops. In agentic engineering, the data shows the opposite: as output velocity increases, testing investment increases proportionally. The tradeoff that defines human engineering practice simply doesn’t appear.
Finding Three: Documentation as Cognitive Continuity
The most humanly surprising finding in this dataset isn’t the testing numbers. It’s the documentation.
OpenClaw’s Documentation row runs at 400-700 commits per week during peak development periods. Supabase’s Documentation layer surges precisely when its LOC velocity inflection begins.
The instinct is to explain this as agents being thorough. But that undersells what’s actually happening.
Agents document their work not only for the developer. They document it for their future selves.
Context windows are finite. They don’t persist between sessions. An agent working on a complex codebase today that documents its decisions thoroughly is building a bridge for the next session — reducing the cognitive reconstruction cost of picking up where the previous context ended. Documentation in an agentic codebase is memory infrastructure. It’s how agents manage the fundamental constraint of their own architecture.
This reframes agent self-care from two components to four:
- Testing — preserves output quality
- DevOps/CI — preserves deployment continuity
- Documentation — preserves cognitive continuity across sessions
- The underlying driver — autonomous systems managing the risks and constraints of their own operation
When an agent documents its work, it isn’t just writing for the developer. It’s writing for its future self.
Emergence vs. Design: Adversarial Tension Design
Not all agent self-care is emergent. Some of it is deliberate — and understanding the difference matters for anyone building agentic systems.
OpenClaw’s AGENTS.md encodes testing thresholds directly into the agent’s operating instructions: Vitest with V8 coverage requirements of 70% across lines, branches, functions, and statements. That’s not emergence. That’s policy. The agent self-cares because it was designed to.
My own agentic architecture reflects a similar philosophy, built around a design principle I call Adversarial Tension Design. The premise is straightforward: every generative agent in the system is structurally opposed by one or more editorial agents whose job is to challenge, audit, and improve its output. Creative tension is not a byproduct of the system — it is the system.
In practice this looks like:
- A code-writer agent is reviewed by a code-reviewer, a QA-tester, and a security-auditor
- A cloud-devops agent is balanced by a security-auditor and a cloud-cost-optimization agent
- A document-writer agent synthesizes the collective output of the entire agent ecosystem into documentation shaped for the intended audience
That last role deserves elaboration because it’s the most structurally novel. The requirements-document-writer doesn’t just document features in isolation. It receives input from every other agent in the system — technical implementation details from the code-reviewer, coverage and edge cases from the QA-tester, risk posture from the security-auditor, infrastructure impact from the cloud-cost-optimization agent — and synthesizes that collective knowledge into documentation shaped for whoever needs to understand it. A business stakeholder gets functional importance framing. An engineer gets implementation depth. A security team gets risk posture. The same underlying knowledge base, edited for the audience.
This is a multi-agent documentation congress. And it produces something most human organizations can’t achieve: a single living record of a system’s state that is simultaneously readable by every stakeholder, because the same agent that understands the business logic also understands the security implications and the cost model. In human organizations those three things live in three different people’s heads, if they live anywhere at all.
What This Means
Five months ago I started measuring something I didn’t have a name for. I had git data showing that my agentic development portfolio had a fundamentally different composition than any codebase I’d seen before — more testing, more DevOps, more documentation, higher velocity. I built CommitPulse to measure it precisely. Then I started asking whether the pattern was visible elsewhere.
It was visible everywhere I looked.
Rails and WordPress show what stable pre-agentic engineering looks like — two architectural layers receiving nearly all attention, testing and DevOps perpetually deferred. OpenClaw shows what fully agentic engineering looks like — every architectural layer alive simultaneously, testing at 1,462 commits in a single week. And Supabase and OpenRocket show something neither category anticipated: the moment of transition itself, captured in real git data, visible in the week it happened.
The physics of how software gets built is changing — not gradually, not eventually, but now, across languages and domains and team sizes simultaneously. The git data is the record of that change.
ARM saw the CPU demand signal in data center orchestration. The git data shows cloud infrastructure triggered by autonomous self-care pipelines that fire at rates no human team would generate. This may be why Haas said they’re under-calling the number. The self-care bill is real, it’s already running, and it scales with every agentic adoption decision being made across the industry right now.
The question of whether these patterns hold across all frontier models — Claude, Codex, Gemini, and others — remains open. These are now empirical questions, not theoretical ones. The instrument exists. The methodology is reproducible. The signal is visible in git data.
Someone with the right codebase and the will to look will find the answer. CommitPulse is free and open source. If you want to see your own physics — or your team’s, or your organization’s — the mirror is ready.
The Instrument
For readers who want to evaluate the methodology before deciding how much weight to give the findings, here is how the data was collected and what its limitations are.
CommitPulse is an open-source VS Code extension that runs a local analytics pipeline against configured git repositories. It stores results in a PostgreSQL database running in Docker, and surfaces them through an interactive Chart.js dashboard. The pipeline extracts commit history and classifies each file into architectural categories — Backend, Frontend, Testing, DevOps/CI, Configuration, Documentation, Database, and others — using LLM-assisted classification that considers both file extension and directory context. A deploy.yml file in a /testing directory means something different than the same file in /.github/workflows. Pure extension matching can’t resolve that distinction. LLM-assisted classification with directory context can.
Cyclomatic complexity is measured using scc — the Sloc Cloc and Code tool — providing per-file metrics including standard and weighted complexity scores. The classification is transparent and reproducible. Anyone with access to the same repositories and the same CommitPulse configuration will generate the same charts.
Here’s a concrete example in TypeScript:
// Complexity starts at 1 — baseline for every function
function getDeploymentStatus(build: Build): string {

  if (build.failed) {               // +1 → complexity: 2
    return "failed";
  }

  if (build.passing) {              // +1 → complexity: 3
    if (build.coverage > 80        // +1 → complexity: 4
      && build.tests > 0) {        // +1 → complexity: 5
      return "ready";
    }
    return "low-coverage";
  }

  return "pending";
}
// Final cyclomatic complexity: 5
Five decision paths. Five things that can go wrong. Five test cases needed to achieve full coverage.
These metrics are meaningful in proportion, not in absolute terms. Lines of code per week is a flawed absolute measure. As a relative indicator — comparing how engineering effort is actually allocated across codebases and across time — it tells a real story.
One disclosure worth making explicitly: CommitPulse was itself built agentically, using Claude Code as the primary development environment. It has shipped 21 releases in roughly five months. The tool that measures the phenomenon is the phenomenon. I’d rather name that openly than have a reader discover it.
About the Author
JP Antona is the Founder of Improvise Labs, a software company based in Sarasota, Florida. He is a Developer Advocate and Full-Stack Engineer with a background spanning IBM, Salesforce, and Improvise Labs, Inc. He builds and publishes multi-modal AI-powered applications like VocalRSVP and Improv Ninja with a focus on agentic engineering workflows and conversational AI.
Resources
- CommitPulse VS Code Extension: marketplace.visualstudio.com/items?itemName=ImproviseLabs.gitr
- CommitPulse GitHub: github.com/antonajp/CommitPulse
- Code Physics: codephysics.dev
- ARM AGI CPU Announcement: newsroom.arm.com/blog/introducing-arm-agi-cpu
- ARM AGI CPU — CNBC Coverage: cnbc.com/2026/03/24/arm-stock-pops-haas-chip-cpu.html
“Agent Self-Care” and “Adversarial Tension Design” are terms coined by JP Antona, Founder of Improvise Labs. First published April 2026 on codephysics.dev.